By Aldo Santamaria | April 23, 2026
These statistical statements represent forecasted renewable energy generation; they’re useful for estimating project returns and sizing debt
One basic project finance foundation I have come to understand while at Pivotal180, and something very familiar to anyone working in the sector, is that revenue is driven by forecasts. Parties make financial decisions long before an asset is built and long before any real cash exists. And that is the reason why models cannot be based on actual results: they simply have not occurred yet!
This holds especially true for renewable energy projects, like utility-scale solar and wind farms, which are inherently probabilistic businesses. After all, who knows how much the wind will blow or the sun will shine on any given day? Even the best meteorologists readily admit their forecasts are never perfectly accurate.
At this point, some people may ask: if these estimates are never 100% exact, why don’t we just ignore them altogether? A cautious answer would be: please don’t. While forecasts rarely give us the “correct” answer, they do provide us with something valuable: a range of possible outcomes we can use for our financial decision-making.
But what Are P-Factors, really?
Let’s use our imagination for a moment. Picture a huge, utility-scale solar project during a clear, sunny day. Hundreds of people nearby enjoy having lunch inside their air-conditioned homes and workplaces, while others stay outside, just enjoying the nice weather. After a few minutes, the sky turns into a scary, dark gray color. A storm is coming!
This shows us that renewable energy assets must perform under a myriad of possible weather conditions. And if you were to simulate those conditions, you would not arrive at a single outcome, but rather at a distribution of outcomes. There are sunny days, and cloudy days, both very possible. Here is where we turn to basic statistics.
Back from our school days, the Central Limit Theorem (CLT) tells us that as we combine enough independent variables (in this case, how much energy the project will generate across many years), the expected outcomes will tend toward a normal, bell-shaped distribution.
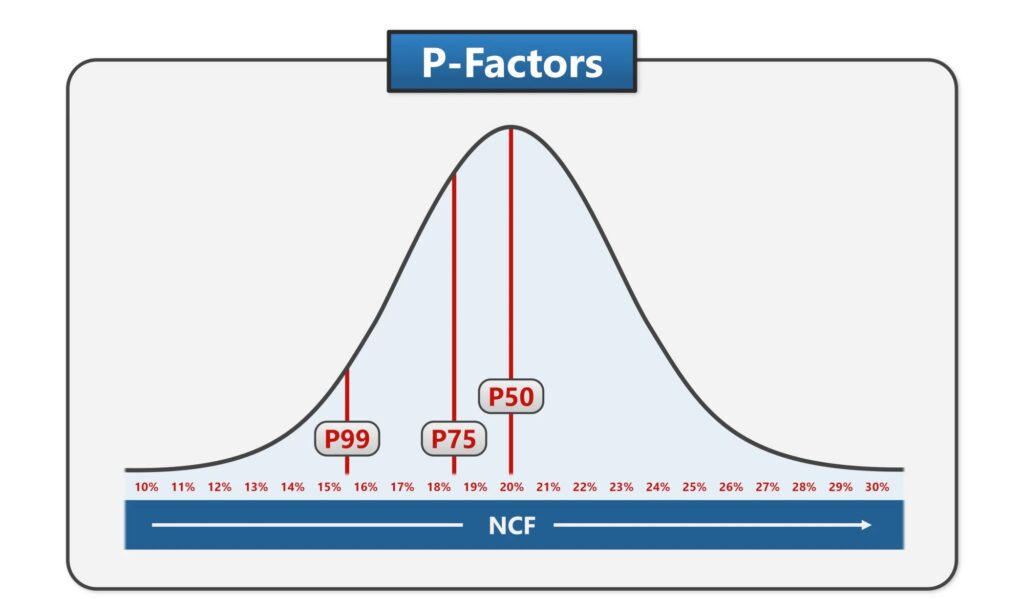
P-Factors are labels placed on a normal (bell-shaped) distribution curve
Well, P-Factors are simply labels placed on that distribution. They describe the probability of exceedance, that is, the likelihood that actual performance over a given year will be higher than a specific forecast value. One way to visualize them is through a vertical line on a specific part of the bell-shaped curve.
Interpreting P50, P75, and P99 in Project Finance
So, which specific P-numbers are used more often for project finance modeling? If you asked any Pivotal180 instructor, they would tell you that P50, P75 and P99 are all relevant. There is also P90, which serves a very specific purpose that we will cover in our P-Factors mini-course. But for now, let’s focus on these three main ones.
A P50 sits at the center of the distribution: it implies a 50% probability that actual performance will exceed the forecast value. At the same time, there is a 50% probability that it will fall below. We saw earlier that the normal distribution curve already represents an average of all possible future outcomes. In that sense, we can think of P50 as “the mean of means”.
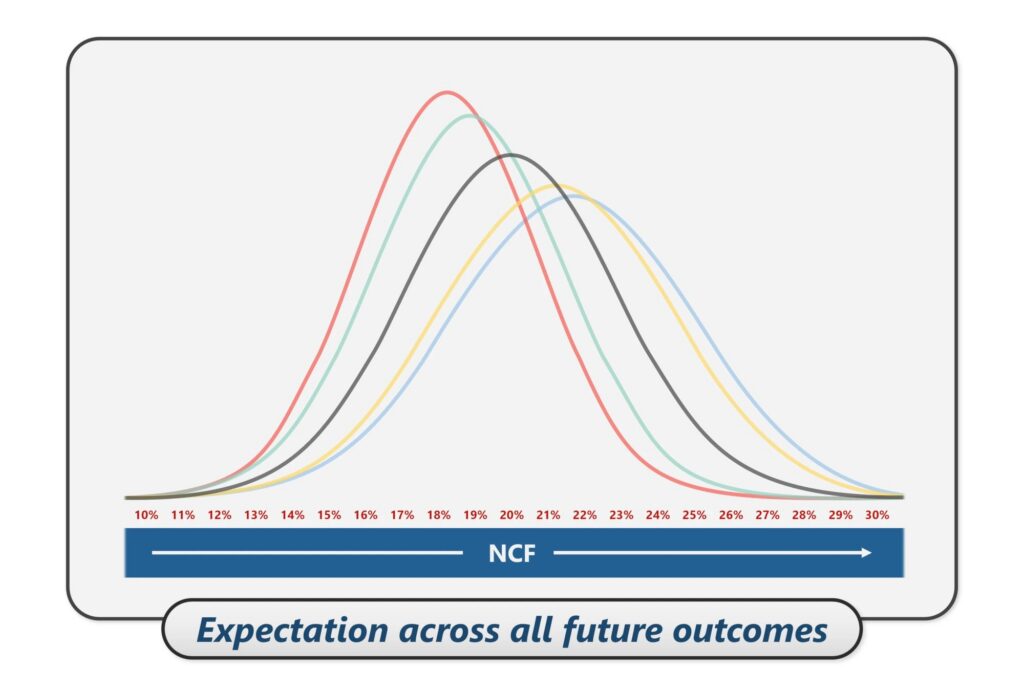
Normal distribution curves used in Renewable Energy Project Finance represent an average of all possible future outcomes
Another common P-Factor is P75, which constitutes a more conservative position. It means there is a 75% probability that actual performance will end up exceeding the forecast value. To achieve that increased level of confidence, the associated expected generation must necessarily fall well below that of P50. If the P-number is higher, the forecasted outputs will be lower.
Finally, P99 would sit deep into the downside tail of the distribution curve. It reflects an extremely cautious view, with 99% probability that actual performance will exceed the forecast value. Lenders typically look at P99 to make sure that, even under such a negative scenario, they can break even at minimum.
From P-Factors to cashflows
I personally find these conceptual explanations super-interesting, but for financial modelers, the next question would be: how do they translate into estimated energy production and, ultimately, revenue? Each P-Factor corresponds to a specific Net Capacity Factor (NCF), that is, the percentage of a plant’s actual output, relative to its full nameplate capacity.
For example, if a solar project has a 20% NCF, we are expecting it to generate (on average over the long term) a fifth of its maximum theoretical output. We just feed that NCF into the generation calculations using this simple formula:
Generation = Nameplate Capacity x Time x NCF
For annual calculations, “Time” is 8,760 hours. Considering a 100-megawatt project, the expected annual generation would be:
100 MW x 8,760 hours x 20% = 175,200 MWh per year
Now, let’s take the same project using a P99 NCF of 15.4%:
100 MW x 8,760 hours x 15.4% = 134,904 MWh per year
The difference on modeled cashflows is substantial, even though the assumed solar plant is the exact same asset with the exact same theoretical highest possible output.
Why P-Factors matter for Project Finance
Remember: these are forecasts, not reality. Different parties may even rely on different versions of the same P-Factor based on their own technical consultants. For instance, lenders may use both P50 and P99, paired with Debt Service Coverage Ratios (DSCR), to size debt. Equity, on the other hand, may turn to its own P50 to evaluate returns.
And the logic applies well beyond renewables: mines, toll roads and airports, just to name a few, all rely on forecasts. We can understand all these not just as technical outputs, but as a shared language for negotiating risk and capital structure.
Training with Pivotal180
We cover this topic in our advanced debt course and as its own mini course coming in May.
The Advanced Debt Course builds on our project finance modeling courses covering topics such as blended DSCR debt sizing, leverage constraints, P90 sweeps, junior debt, refinancing, and multi-tranche debt.
Pivotal180’s project finance modeling courses are designed to familiarize anyone from analysts to the C-suite with the knowledge and skills to build, analyze and communicate clearly about project finance models:
Course participants will learn how risk is allocated between lenders and sponsors, understand the structure and drivers of project finance transactions, and gain the necessary skills to run and evaluate operational or financing scenarios required to identify the most substantial risks and opportunities for any deal.
For readers looking to move from concept to application, Pivotal180 offers practical courses in Project Finance Modeling, as well as industry-specific programs covering areas such as battery storage and mining, with a focus on real-world
Come model with us!
