By Haydn Palliser | December 5, 2019
Overview
This is an extract from our pre-course videos for our renewable energy and infrastructure project finance modeling course. This lesson will introduce you to control accounts and their benefits.
Video

Video Transcript
Haydn: If you listened to the lesson on binary flags, you may remember there are three things that fundamentally changed my approach to financial modeling. First, sensitivities and scenarios, which we cover throughout the course. Second, binary flags, used to indicate when something occurs over a specific duration. And third, the topic of this lesson and something dear to my heart: control accounts.
Here we won’t cover the specific formula, as it depends on the problem we are actually tackling. We’ll go through that later in the course.
Control accounts: meaning and example
A control account is a summary-level account used to show information in a simple and clear manner. I can honestly say this best practice concept changed my life. After all, models are full of numbers, and we constantly record something over time, such as the money we owe to someone, the amounts of inventory I have on my balance sheet, or perhaps a volume of physical items. One example would be the number of pens I may or may not have stolen from Dan’s desk…
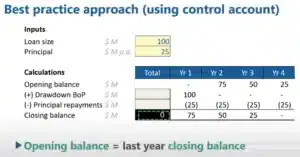
Anyway, let’s use a really simple example of a $100 million loan with four equal annual principal repayments of $25 million to introduce the concept of an account. My inputs are separated from my calculations, as learned in the introduction to best practice modeling.
In the calculations section, I have my control account calculations, which represents the balance of the loan over time. There are four labels in the section:
- Opening balance: The balance of a loan at the start of the period, or how much we owe the lenders.
- (+) Drawdown BOP: Any money I draw down on my loan, in this case during year one. BOP stands for Beginning Of Period, so I’m assuming the drawdown occurs at the start of the year.
- (-) Principal repayments: The principal I’m paying back to the lenders. We assume it occurs at the end of the year.
- Closing balance: The balance of the loan at the end of the year.
Control accounts calculations example
Let’s take a look at the calculations. At the beginning of year one, I draw down $100 million. It is positive as it increases the amount of the loan I owe, it adds to my account balance. The $25 million repayment in year one reduces my balance, so we make this a negative.
You may also notice the label of minus (-) in principal repayments, as they translate as a reduction in the balance. Drawdowns, on the other hand, are labeled wth a plus (+); they add to the balance. Be obvious. This helps the user. Who knows, maybe even I will understand it.
Following our example, I have a closing balance of $75 million in year one, since $100 million minus $25 million equals $75 million. My opening balance for year two is exactly the same. Why? Well, the closing balance corresponds to the very last second of year one, and the opening balance is just the very first second of year two. Nothing has changed in that one second.
The opening balance for year two is exactly the same as the closing balance from the previous year.
Now, let’s continue to the end of year two, when I repay another $25 million and therefore reduce my balance to $50 million. As calculations must be consistent across the row, I copy and paste to the next years and the loan pays down, as expected, to $0 at the end of year four. I’m not quite done, though. I haven’t actually added an opening balance in year one.
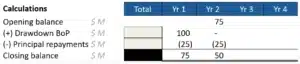
Given that I need to copy one formula across the whole row, this should be the same calculation as the rest of the row, where the opening balances always refer to the previous period’s closing balance. But if I do that, I’m linking to the closing balance in the totals column, as you can see in this next image.
The opening balance for year one should be equal to the previous closing balance, but that cell is actually in the totals column!
Control accounts best practices
Dan: But Haydn, isn’t that a really bad practice?
Haydn: Fair point, Dan. Some people may not like this, and best practice modeling is really subjective. What we do at Pivotal180 is creating a style called blank, shown as black on the screen with no value in the closing balance line under the total column. This tells the user not to touch the cell. It is being used for something. So, personally, Dan, I’m okay with it.
What’s particularly nice about this account is I can clearly see my opening balance, my draw down, my principal repayments, and my closing balance. It’s uber-clear, and even better, I can see the total drawdowns and the total repayments equal each other. That’s a great check. I want to know if I’ve repaid my loan. Accounts clearly show outputs in an easy to understand manner, but the real power will come as we build these throughout the course.
Just trust me with this one thing: if you have a volume of anything to record over time, start your calculations by building a control account.
Share This Resource